How to implement a charts swiftui view?
Asked on 2025-05-23
1 search

To implement a charts SwiftUI view using Swift Charts, you can follow these steps:
-
Introduction to Swift Charts: Swift Charts is a highly customizable charting framework built on top of SwiftUI, making it easy to create beautiful and informative visualizations. It supports various types of plots, including line plots, area plots, and more.
-
Creating a Basic Chart: Start by defining a SwiftUI view and using the
Chartcomponent to create a basic chart. You can use modifiers to customize the appearance of your chart. -
Function Plots: Swift Charts allows you to plot mathematical functions. You can use line plots for visualizing a single function and area plots to fill in the area between two functions. You can customize the color and opacity to make your plots more legible. For more advanced function plots, you can visualize the area between two functions by returning a tuple of y start and y end for a given input x.
-
Vectorized Plots: Swift Charts also supports vectorized plotting APIs, which are efficient for visualizing larger datasets. You can use key paths to access data points and apply modifiers to style the points without iterating over the dataset.
-
Accessibility: Swift Charts makes your chart accessible by default. You can use VoiceOver to describe the chart, ensuring that data visualizations are accessible to everyone.
For a detailed walkthrough on creating function plots, you can refer to the session Swift Charts: Vectorized and function plots (01:01).
If you want to learn more about integrating Swift Charts with SwiftUI, you can check out the session SwiftUI essentials (20:30), which discusses the interoperability of SwiftUI with other SDKs, including Swift Charts.
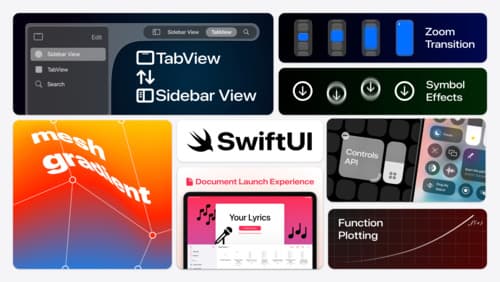
What’s new in SwiftUI
Learn how you can use SwiftUI to build great apps for any Apple platform. Explore a fresh new look and feel for tabs and documents on iPadOS. Improve your window management with new windowing APIs, and gain more control over immersive spaces and volumes in your visionOS apps. We’ll also take you through other exciting refinements that help you make expressive charts, customize and layout text, and so much more.
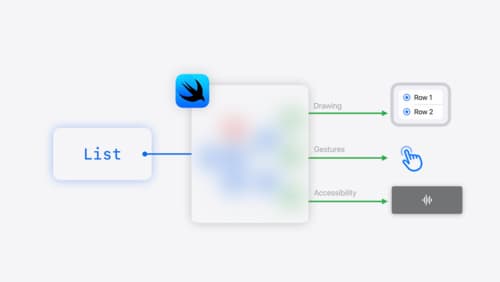
SwiftUI essentials
Join us on a tour of SwiftUI, Apple’s declarative user interface framework. Learn essential concepts for building apps in SwiftUI, like views, state variables, and layout. Discover the breadth of APIs for building fully featured experiences and crafting unique custom components. Whether you’re brand new to SwiftUI or an experienced developer, you’ll learn how to take advantage of what SwiftUI has to offer when building great apps.
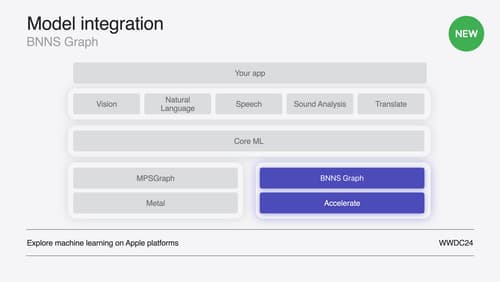
Support real-time ML inference on the CPU
Discover how you can use BNNSGraph to accelerate the execution of your machine learning model on the CPU. We will show you how to use BNNSGraph to compile and execute a machine learning model on the CPU and share how it provides real-time guarantees such as no runtime memory allocation and single-threaded running for audio or signal processing models.