how to discover crash and deal with it
Asked on 2025-06-05
1 search

To discover and deal with crashes in your application, you can utilize several techniques and tools presented at WWDC:
-
Crash Logs and LLDB: When a program crashes, a crash log is created that contains information about the state of the program at the time of the crash. You can use LLDB to open and inspect these crash logs, which can help you understand how the crash happened. This process is detailed in the session Run, Break, Inspect: Explore effective debugging in LLDB.
-
Using Breakpoints in Xcode: Breakpoints are a powerful tool to pause program execution and inspect the state of your application. You can set breakpoints at specific lines of code or on exceptions to catch errors as they occur. The session Xcode essentials provides insights into setting and managing breakpoints effectively.
-
Backtraces: When a crash occurs, backtraces can help you understand the sequence of function calls that led to the crash. This can be particularly useful in identifying the control flow and pinpointing the source of the problem. This is also covered in the session Run, Break, Inspect: Explore effective debugging in LLDB.
-
Swift Error Breakpoints: If your application is throwing Swift errors, you can add a Swift error breakpoint to stop execution right where the error is thrown, allowing you to inspect the state of the program at that point. This technique is discussed in the session Xcode essentials.
By using these tools and techniques, you can effectively discover and diagnose crashes in your application, making it easier to identify and fix bugs.
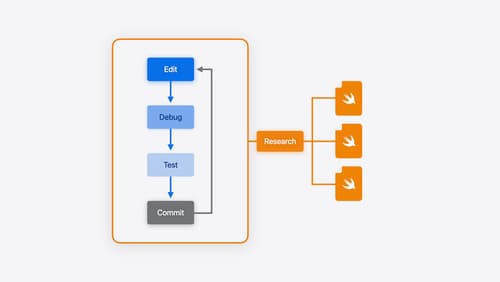
Xcode essentials
Edit, debug, commit, repeat. Explore the suite of tools in Xcode that help you iterate quickly when developing apps. Discover tips and tricks to help optimize and boost your development workflow.
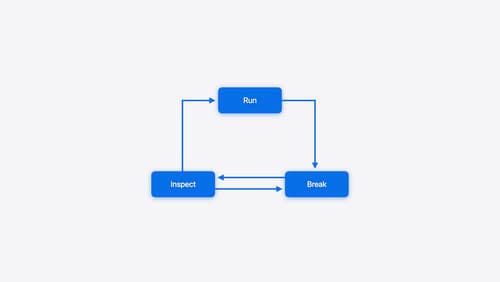
Run, Break, Inspect: Explore effective debugging in LLDB
Learn how to use LLDB to explore and debug codebases. We’ll show you how to make the most of crashlogs and backtraces, and how to supercharge breakpoints with actions and complex stop conditions. We’ll also explore how the “p” command and the latest features in Swift 6 can enhance your debugging experience.