How to debug with instruments
Asked on 2025-06-06
1 search

To debug with Instruments, you can follow these steps based on the content from the WWDC sessions:
-
Access Instruments: You can access Instruments from Xcode's profile action. This is useful for diagnosing performance problems, such as high CPU usage or memory issues.
-
Choose the Right Template: When Instruments opens, it will ask you to choose a template for profiling. For memory issues, you might choose the "Allocations" template, which records the history of all allocation and free events over time. This helps in tracking memory usage back to your code.
-
Use the Allocations Instrument: The allocations instrument can help you investigate memory issues by recording heap and VM allocations. You can use it to identify patterns of transient and persistent memory growth.
-
Analyze the Data: Once you have a trace, you can use features like the flame graph to visualize CPU usage and identify bottlenecks. For memory, you can use generation marking to isolate persistent allocations and identify what types are responsible for growth.
-
Fix Issues: After identifying issues, you can make changes to your code, such as adding autorelease pool scopes to manage memory more effectively, and then re-profile to see if the changes helped.
For more detailed guidance, you can refer to the session Analyze heap memory (03:45) which covers tools for inspecting heap memory issues, and What’s new in Xcode 16 (18:42) which discusses new features in Instruments.

Analyze heap memory
Dive into the basis for your app’s dynamic memory: the heap! Explore how to use Instruments and Xcode to measure, analyze, and fix common heap issues. We’ll also cover some techniques and best practices for diagnosing transient growth, persistent growth, and leaks in your app.
What’s new in Xcode 16
Discover the latest productivity and performance improvements in Xcode 16. Learn about enhancements to code completion, diagnostics, and Xcode Previews. Find out more about updates in builds and explore improvements in debugging and Instruments.
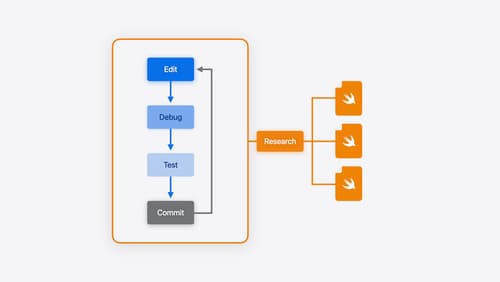
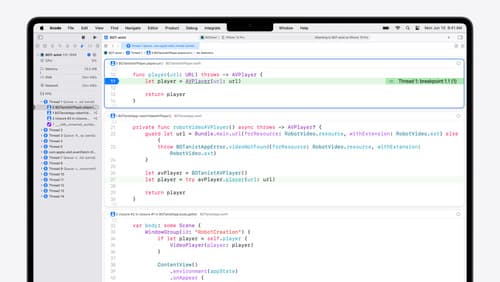
Xcode essentials
Edit, debug, commit, repeat. Explore the suite of tools in Xcode that help you iterate quickly when developing apps. Discover tips and tricks to help optimize and boost your development workflow.