What's new in Swift Charts?
Asked on 2024-07-30
1 search

In the latest release of Swift Charts, several new features have been introduced to enhance data visualization capabilities. Here are the key updates:
-
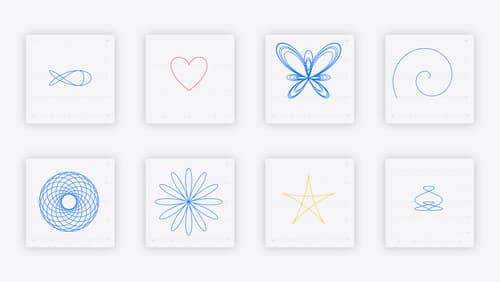
Function Plots:
- Single Function Line Plot: Allows for visualizing a single mathematical function.
- Area Plot: Fills the area between two functions, making it easier to visualize the space under a curve or between curves.
- Parametric Functions: Supports plotting parametric functions where x and y are defined in terms of a third variable, t.
- Piecewise Functions: Handles piecewise functions, including cases where certain values in the domain do not have an output.
-
Vectorized Plotting APIs:
- Efficiency: Supports visualizing larger datasets more efficiently by reducing the number of style alternations and computations during rendering.
- Customization: Allows for skipping certain style customizations for larger datasets to improve performance.
-
Accessibility:
- VoiceOver Support: Ensures that charts are accessible by default, with VoiceOver describing the chart elements.
-
Customization:
- Modifiers: Similar to SwiftUI, modifiers can be used to customize the appearance of function plots, such as changing colors and filling areas under curves.
For a detailed walkthrough of these features, you can watch the session Swift Charts: Vectorized and function plots starting at 00:01:01.

Get started with HealthKit in visionOS
Discover how to use HealthKit to create experiences that take full advantage of the spatial canvas. Learn the capabilities of HealthKit on the platform, find out how to bring an existing iPadOS app to visionOS, and explore the special considerations governing HealthKit during a Guest User session. You’ll also learn ways to use SwiftUI, Swift Charts, and Swift concurrency to craft innovative experiences with HealthKit.
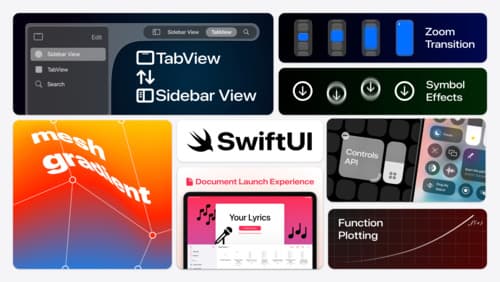
What’s new in SwiftUI
Learn how you can use SwiftUI to build great apps for any Apple platform. Explore a fresh new look and feel for tabs and documents on iPadOS. Improve your window management with new windowing APIs, and gain more control over immersive spaces and volumes in your visionOS apps. We’ll also take you through other exciting refinements that help you make expressive charts, customize and layout text, and so much more.
Swift Charts: Vectorized and function plots
The plot thickens! Learn how to render beautiful charts representing math functions and extensive datasets using function and vectorized plots in your app. Whether you’re looking to display functions common in aerodynamics, magnetism, and higher order field theory, or create large interactive heat maps, Swift Charts has you covered.