how can I debug live activities
Asked on 2024-07-30
1 search

To debug live activities, you can utilize several techniques and tools presented at WWDC. Here are some relevant sessions and tips:
-
Using LLDB for Debugging:
- Breakpoints: Set breakpoints at strategic points in your code to pause execution and inspect the state of your program. This can help you identify where things might be going wrong.
- Variable Inspection: Use LLDB to inspect variables and their values at different points in time. This can be done by hovering over variables in Xcode or using the variable viewer.
- Crash Logs: LLDB can consume crash logs and present them in a form that resembles a debugging session, which can be very useful for post-mortem debugging.
- Expression Evaluation: Use the
pcommand in LLDB to evaluate expressions and inspect the state of your program without modifying the code.
For more detailed guidance, you can refer to the session Run, Break, Inspect: Explore effective debugging in LLDB.
-
Xcode Essentials:
- Conditional Breakpoints: Set breakpoints that only trigger under certain conditions to avoid stopping execution too frequently.
- Debugger Expressions: Add debugger expressions to breakpoints to print logs or evaluate conditions without stopping the program. This can help you gather information without interrupting the flow of your application.
For more tips on debugging in Xcode, check out the session Xcode essentials.
-
RealityKit Debugger:
- Entity Hierarchy Visualization: Use the RealityKit debugger to visualize the state of entities in your app. This can help you understand the current state and identify issues with live activities.
- Debug Components: Add debug components to your entities to display counters, states, or even custom visualizations like Swift charts.
For more information on using the RealityKit debugger, see the session Break into the RealityKit debugger.
By leveraging these tools and techniques, you can effectively debug live activities in your applications.
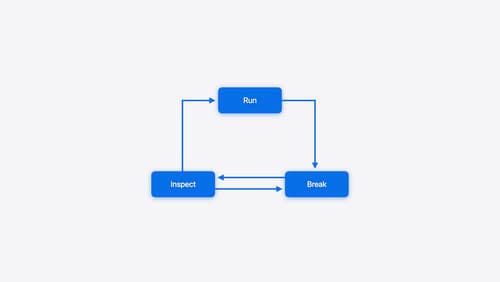
Run, Break, Inspect: Explore effective debugging in LLDB
Learn how to use LLDB to explore and debug codebases. We’ll show you how to make the most of crashlogs and backtraces, and how to supercharge breakpoints with actions and complex stop conditions. We’ll also explore how the “p” command and the latest features in Swift 6 can enhance your debugging experience.
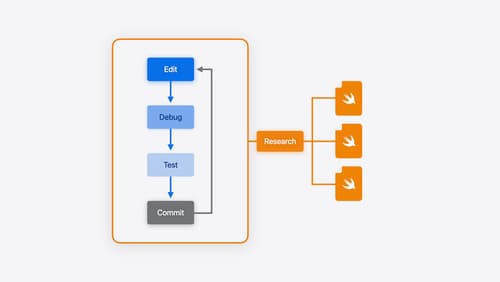
Xcode essentials
Edit, debug, commit, repeat. Explore the suite of tools in Xcode that help you iterate quickly when developing apps. Discover tips and tricks to help optimize and boost your development workflow.
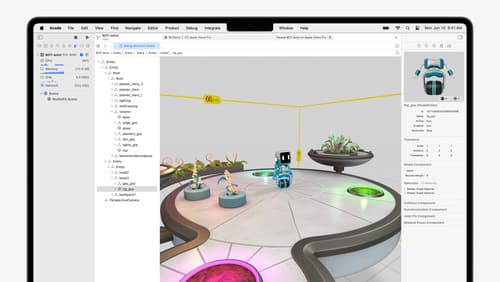
Break into the RealityKit debugger
Meet the RealityKit debugger and discover how this new tool lets you inspect the entity hierarchy of spatial apps, debug rogue transformations, find missing entities, and detect which parts of your code are causing problems for your systems.