What is this
Asked on 2024-07-30
6 searches

The session "Analyze heap memory" at WWDC 2024 covers various aspects of inspecting and managing heap memory in applications. Here are some key points discussed in the session:
-
Heap Memory Overview: The session starts with an overview of heap memory and its importance in application performance.
-
Tools for Inspecting Heap Memory Issues: Various tools are introduced to help developers inspect and debug heap memory issues, such as the Xcode memory graph debugger and Instruments.
-
Transient Memory Growth Overview: This section discusses how to manage transient memory growth, which is temporary memory that gets allocated and deallocated frequently.
-
Persistent Memory Growth Overview: Persistent memory growth, where memory allocations are not deallocated as expected, is also covered. The session explains how to identify and resolve such issues using tools like the memory graph debugger.
-
How the Xcode Memory Graph Debugger Works: Detailed explanation of how the memory graph debugger works, including type information and scanning for references.
-
Resolving Leaks of Swift Closure Contexts: The session also addresses how to resolve memory leaks caused by Swift closure contexts, which can create reference cycles if not managed properly.
-
Comparing Performance of Weak and Unowned: The session compares the performance implications of using weak and unowned references to break reference cycles.
For more detailed information, you can refer to the specific chapters of the session:
- Heap memory overview
- Tools for inspecting heap memory issues
- Transient memory growth overview
- Persistent memory growth overview
- How the Xcode memory graph debugger works
- Resolving leaks of Swift closure contexts
- Comparing performance of weak and unowned
These chapters provide a comprehensive guide to understanding and managing heap memory in your applications.

Analyze heap memory
Dive into the basis for your app’s dynamic memory: the heap! Explore how to use Instruments and Xcode to measure, analyze, and fix common heap issues. We’ll also cover some techniques and best practices for diagnosing transient growth, persistent growth, and leaks in your app.
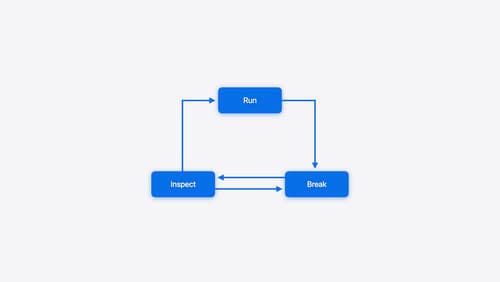
Run, Break, Inspect: Explore effective debugging in LLDB
Learn how to use LLDB to explore and debug codebases. We’ll show you how to make the most of crashlogs and backtraces, and how to supercharge breakpoints with actions and complex stop conditions. We’ll also explore how the “p” command and the latest features in Swift 6 can enhance your debugging experience.
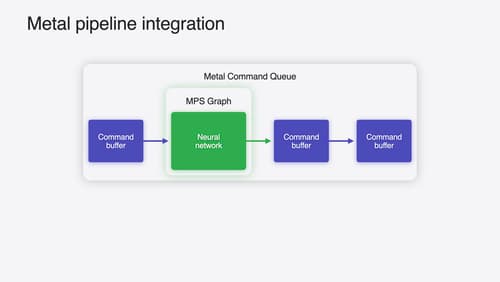
Accelerate machine learning with Metal
Learn how to accelerate your machine learning transformer models with new features in Metal Performance Shaders Graph. We’ll also cover how to improve your model’s compute bandwidth and quality, and visualize it in the all new MPSGraph viewer.