how can I debug a homekit environment?
Asked on 2024-07-30
1 search

To debug a HomeKit environment, you can follow these steps:
-
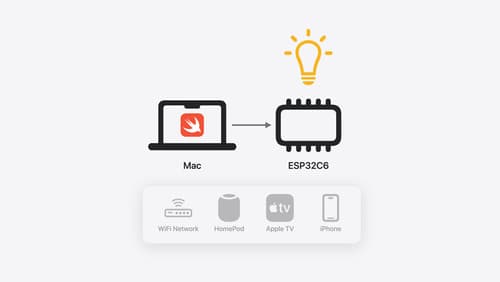
Set Up Your HomeKit Environment: Ensure you have a working HomeKit setup with a Wi-Fi network and some existing Apple devices connected to it. This is essential for testing and debugging HomeKit accessories.
-
Develop and Flash Your HomeKit Accessory: Use a programmable embedded device, such as an ESP32-C6 development board, and write a program in Embedded Swift to implement a HomeKit accessory. Flash this program onto the device and ensure it joins your Wi-Fi and HomeKit network. You can control it from the Home app on your Apple devices. For more details, you can refer to the session Go small with Embedded Swift.
-
Monitor Device Logs: As you control the accessory from the Home app, monitor the device logs to see the events for the commands. This helps in understanding the communication between the Home app and the accessory. You can log incoming events and use them to debug issues. For example, you can see how events are logged and handled in the session Go small with Embedded Swift.
-
Use Debugging Tools in Xcode: Utilize Xcode's debugging tools to inspect and debug your HomeKit accessory code. Xcode 16 offers various debugging features, such as the RealityKit debugger, which can capture a snapshot of your running app's entity hierarchy and explore it in 3D. This can be particularly useful if your HomeKit accessory involves 3D components. Learn more about this in the session Break into the RealityKit debugger.
-
Structured Logging and Breakpoints: Instead of using print statements, consider using structured logging with
os_logfor better readability and sharing of debug information. Set breakpoints in your code to pause execution and inspect the state of your application at specific points. This can help identify where things might be going wrong. For more on effective debugging, refer to the session Run, Break, Inspect: Explore effective debugging in LLDB.
By following these steps and utilizing the tools and techniques mentioned, you can effectively debug your HomeKit environment and ensure your accessories work as expected.
Go small with Embedded Swift
Embedded Swift brings the safety and expressivity of Swift to constrained environments. Explore how Embedded Swift runs on a variety of microcontrollers through a demonstration using an off-the-shelf Matter device. Learn how the Embedded Swift subset packs the benefits of Swift into a tiny footprint with no runtime, and discover plenty of resources to start your own Embedded Swift adventure.
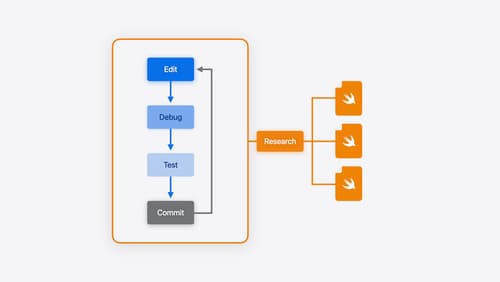
Xcode essentials
Edit, debug, commit, repeat. Explore the suite of tools in Xcode that help you iterate quickly when developing apps. Discover tips and tricks to help optimize and boost your development workflow.

Support semantic search with Core Spotlight
Learn how to provide semantic search results in your app using Core Spotlight. Understand how to make your app’s content available in the user’s private, on-device index so people can search for items using natural language. We’ll also share how to optimize your app’s performance by scheduling indexing activities. To get the most out of this session, we recommend first checking out Core Spotlight documentation on the Apple Developer website.