How can I manage memory manually on VisionPro?
Asked on 2024-07-30
1 search
To manage memory manually on VisionPro, you can utilize the tools and techniques discussed in the session Analyze heap memory. This session covers various aspects of heap memory management, including:
- Measuring Your Heap: Understanding how much memory your app is using and where it is being allocated.
- Dealing with Transient Growth: Identifying and managing temporary spikes in memory usage.
- Tracking Persistent Growth: Monitoring and addressing long-term increases in memory usage.
- Fixing Memory Leaks: Using tools like Xcode's memory graph debugger and Malloc stack logging to find and fix memory leaks.
- Improving Runtime Performance: Optimizing memory usage to enhance the performance of your app.
For a detailed walkthrough on how to use these tools, you can refer to the chapter Tools for inspecting heap memory issues in the session.
If you need to focus on specific allocations, the session also discusses using the allocations instrument and VM tracker in Instruments, as well as command line tools like leaks, heap, vmmap, and malloc_history for in-depth memory analysis.
For more specific guidance on managing autorelease pool growth in Swift, you can check out the chapter Managing autorelease pool growth in Swift.
Here is the ordered list of the session mentioned:

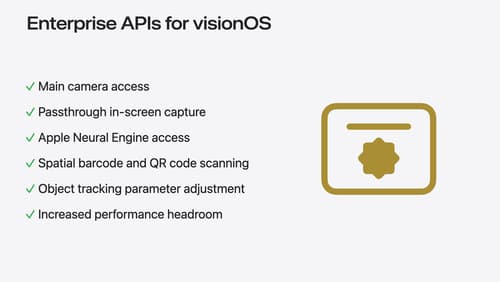
Introducing enterprise APIs for visionOS
Find out how you can use new enterprise APIs for visionOS to create spatial experiences that enhance employee and customer productivity on Apple Vision Pro.

Analyze heap memory
Dive into the basis for your app’s dynamic memory: the heap! Explore how to use Instruments and Xcode to measure, analyze, and fix common heap issues. We’ll also cover some techniques and best practices for diagnosing transient growth, persistent growth, and leaks in your app.
