whee
Asked on 2024-07-30
1 search

It seems like your question "whee" might be a typo or incomplete. However, I can provide some information about the content presented by Apple at WWDC based on the context provided.
Here are some of the sessions mentioned:
-
Enhance your UI animations and transitions
- This session covers new features and APIs for animations in SwiftUI, UIKit, and AppKit. It includes topics like fluid zoom transitions and gesture-driven animations.
- Enhance your UI animations and transitions
-
What’s new in SwiftUI
- This session introduces new APIs and improvements in SwiftUI, including custom containers, vectorized and function plots, mesh gradients, and more.
- What’s new in SwiftUI
-
Catch up on accessibility in SwiftUI
- This session focuses on making SwiftUI apps more accessible, covering fundamentals, view accessibility, and enhanced interactions.
- Catch up on accessibility in SwiftUI
-
Swift Charts: Vectorized and function plots
- This session discusses new capabilities in Swift Charts, including function plots and vectorized plotting APIs for visualizing larger datasets.
- Swift Charts: Vectorized and function plots
If you have a specific question or need more detailed information about a particular topic, feel free to ask!
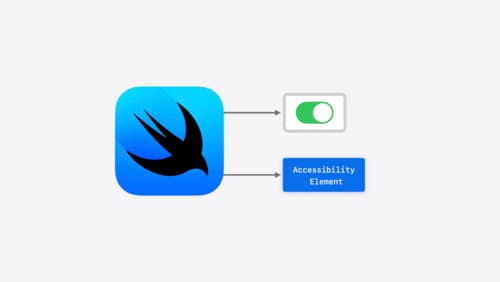
Catch up on accessibility in SwiftUI
SwiftUI makes it easy to build amazing experiences that are accessible to everyone. We’ll discover how assistive technologies understand and navigate your app through the rich accessibility elements provided by SwiftUI. We’ll also discuss how you can further customize these experiences by providing more information about your app’s content and interactions by using accessibility modifiers.
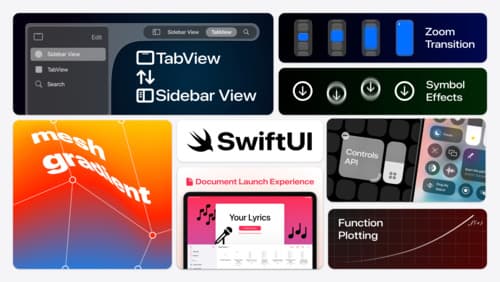
What’s new in SwiftUI
Learn how you can use SwiftUI to build great apps for any Apple platform. Explore a fresh new look and feel for tabs and documents on iPadOS. Improve your window management with new windowing APIs, and gain more control over immersive spaces and volumes in your visionOS apps. We’ll also take you through other exciting refinements that help you make expressive charts, customize and layout text, and so much more.
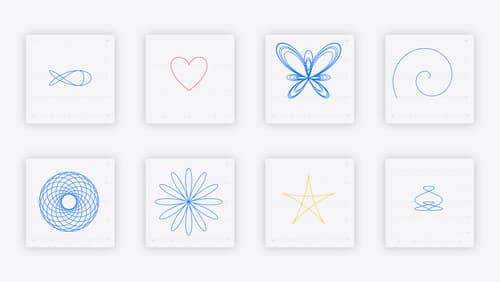
Swift Charts: Vectorized and function plots
The plot thickens! Learn how to render beautiful charts representing math functions and extensive datasets using function and vectorized plots in your app. Whether you’re looking to display functions common in aerodynamics, magnetism, and higher order field theory, or create large interactive heat maps, Swift Charts has you covered.