debug webpage in web iew
Asked on 2025-06-13
1 search

To debug a webpage in a WebView, you can use the Web Inspector tool available in Safari. This tool allows you to inspect DOM content, CSS rules, and use the JavaScript console for debugging purposes. If you're working with Apple Vision Pro, you can connect it to the Web Inspector on your Mac to see all the details. Here's a brief overview of how to get started:
- Ensure Network Connection: Make sure your Mac and Apple Vision Pro are on the same network.
- Enable Web Inspector: On the physical device, find this option under Apps > Safari > Advanced > Web Inspector.
- Connect Devices: Open your Apple Vision Pro to remote devices under Settings > General > Remote Devices.
- Use Safari's Develop Menu: In Safari on your Mac, go to the Develop menu and connect your Apple Vision Pro labeled for development.
For more detailed steps on inspecting web content in VisionOS, you can refer to the session Optimize for the spatial web (17:13).
If you're working with SwiftUI, the session Meet WebKit for SwiftUI (01:54) provides insights on how to load and display web content using the new Webpage class and WebView. This session covers how to load remote URLs, HTML content, and different types of data directly into your web content.
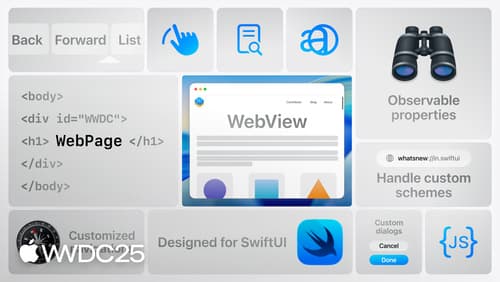
Meet WebKit for SwiftUI
Discover how you can use WebKit to effortlessly integrate web content into your SwiftUI apps. Learn how to load and display web content, communicate with webpages, and more.
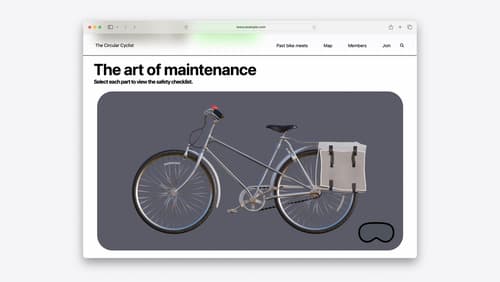
Optimize for the spatial web
Discover how to make the most of visionOS capabilities on the web. Explore recent updates like improvements to selection highlighting, and the ability to present spatial photos and panorama images in fullscreen. Learn to take advantage of existing web standards for dictation and text-to-speech with WebSpeech, spatial soundscapes with WebAudio, and immersive experiences with WebXR.

Build immersive web experiences with WebXR
Discover how WebXR empowers you to add fully immersive experiences to your website in visionOS. Find out how to build WebXR experiences that take full advantage of the input capabilities of visionOS, and learn how you can use Simulator to test WebXR experiences on macOS.