LLDB
Asked on 2025-10-08
1 search

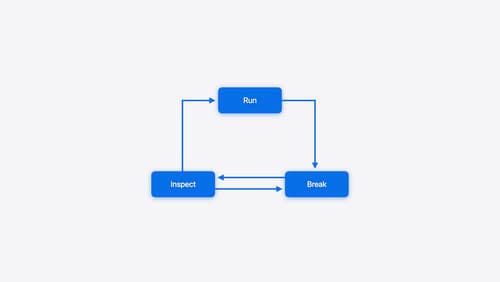
The session titled "Run, Break, Inspect: Explore effective debugging in LLDB" at WWDC 2024 covers various aspects of using LLDB for debugging. LLDB is the debugger that ships with Xcode and is capable of pausing your program, inspecting variables, evaluating expressions, and more. The session discusses:
- Debugging techniques and how LLDB can be used to explore code and find bugs faster.
- The use of crash logs to start debugging without running the program.
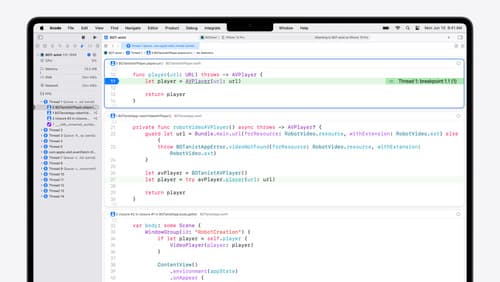
- Setting and managing breakpoints, including conditional breakpoints and breakpoint actions.
- The use of the
pcommand for inspecting variables and evaluating expressions. - New features in Swift 6, such as the
@DebugDescriptionmacro, which allows customization of how data types appear in the debugger.
For more detailed exploration of these topics, you can refer to the session chapters:
Additionally, the session "What’s new in Xcode 16" mentions updates to debugging tools, including the RealityKit debugger, which allows you to capture and explore a snapshot of your app's entity hierarchy in 3D within Xcode.
Run, Break, Inspect: Explore effective debugging in LLDB
Learn how to use LLDB to explore and debug codebases. We’ll show you how to make the most of crashlogs and backtraces, and how to supercharge breakpoints with actions and complex stop conditions. We’ll also explore how the “p” command and the latest features in Swift 6 can enhance your debugging experience.
What’s new in Xcode 16
Discover the latest productivity and performance improvements in Xcode 16. Learn about enhancements to code completion, diagnostics, and Xcode Previews. Find out more about updates in builds and explore improvements in debugging and Instruments.