sessions on debugging crashes
Asked on 2026-01-05
1 search

For sessions on debugging crashes, the most relevant session is "Run, Break, Inspect: Explore effective debugging in LLDB" from WWDC 2024. This session covers various techniques for debugging, including how to handle crash logs using LLDB. It explains how crash logs can be consumed by LLDB to simulate a debugging session, allowing developers to investigate the cause of a crash effectively.
You can find more detailed information on debugging crashes in the chapter titled "Crashlogs & starting the program" in the session "Run, Break, Inspect: Explore effective debugging in LLDB." Here is the link to that chapter: Run, Break, Inspect: Explore effective debugging in LLDB (00:04:07).
Additionally, the session "Xcode essentials" also touches on debugging techniques, including handling crashes and using breakpoints effectively. The relevant chapter for debugging in this session is titled "Debugging": Xcode essentials (00:16:55).
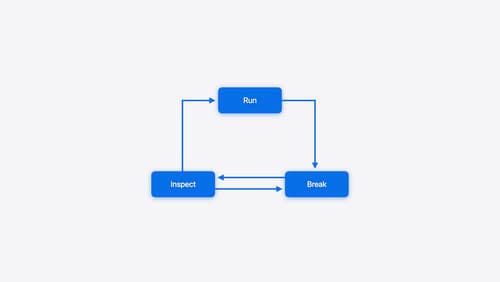
Run, Break, Inspect: Explore effective debugging in LLDB
Learn how to use LLDB to explore and debug codebases. We’ll show you how to make the most of crashlogs and backtraces, and how to supercharge breakpoints with actions and complex stop conditions. We’ll also explore how the “p” command and the latest features in Swift 6 can enhance your debugging experience.
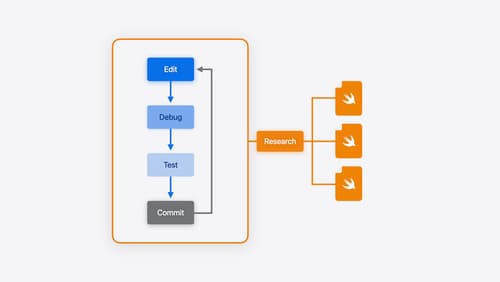
Xcode essentials
Edit, debug, commit, repeat. Explore the suite of tools in Xcode that help you iterate quickly when developing apps. Discover tips and tricks to help optimize and boost your development workflow.
What’s new in Xcode 16
Discover the latest productivity and performance improvements in Xcode 16. Learn about enhancements to code completion, diagnostics, and Xcode Previews. Find out more about updates in builds and explore improvements in debugging and Instruments.