tell me comprehensive info about thangs and how to detect them, solve them and what are they
Asked on 2025-06-25
1 search

It seems like you're asking about "thangs," which might be a typo or misunderstanding. However, I can provide information on debugging and memory management techniques discussed at Apple's WWDC sessions, which might be relevant to detecting and solving issues in software development.
Debugging Techniques
-
Thread Performance Checker: In Xcode 16, the thread performance checker helps identify runtime issues by pinpointing the exact line of code causing problems, even if the issue isn't reproducible locally. This tool is useful for prioritizing issues that have the greatest impact on users. What’s new in Xcode 16
-
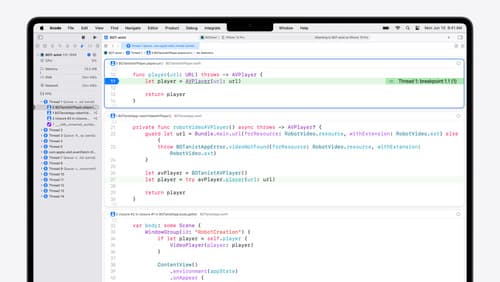
LLDB Debugger: The session "Run, Break, Inspect: Explore effective debugging in LLDB" covers various debugging techniques, such as using breakpoints, inspecting program state, and leveraging the LLDB debugger to understand code bases. This session emphasizes treating debugging as a search problem and using tools like conditional breakpoints and variable inspection. Run, Break, Inspect: Explore effective debugging in LLDB
-
RealityKit Debugger: This tool is used to debug entity hierarchies and components in RealityKit, helping developers track down and fix issues by leveraging visualizations and custom inspectors. Break into the RealityKit debugger
Memory Management
-
Heap Memory Analysis: The session "Analyze heap memory" discusses different types of memory on the heap, such as useful, abandoned, and leaked memory. It provides tools and techniques for identifying and resolving memory leaks, which are often caused by lost pointers or reference cycles. Analyze heap memory
-
Memory Graph Debugger: This tool helps in understanding memory reachability and ensuring memory is deallocated appropriately. It scans for references and helps identify leaks by analyzing the memory graph. Analyze heap memory
These sessions provide comprehensive insights into detecting and solving issues related to debugging and memory management in software development. If you have specific questions about these topics, feel free to ask!
What’s new in Xcode 16
Discover the latest productivity and performance improvements in Xcode 16. Learn about enhancements to code completion, diagnostics, and Xcode Previews. Find out more about updates in builds and explore improvements in debugging and Instruments.

Analyze heap memory
Dive into the basis for your app’s dynamic memory: the heap! Explore how to use Instruments and Xcode to measure, analyze, and fix common heap issues. We’ll also cover some techniques and best practices for diagnosing transient growth, persistent growth, and leaks in your app.
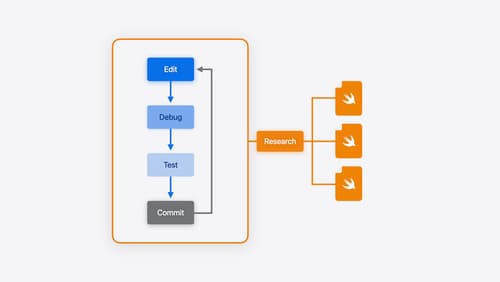
Xcode essentials
Edit, debug, commit, repeat. Explore the suite of tools in Xcode that help you iterate quickly when developing apps. Discover tips and tricks to help optimize and boost your development workflow.