What's new in LLDB?
Asked on 2025-10-08
1 search

At WWDC 2024, several new features and improvements were introduced for LLDB, the debugger that ships with Xcode. Here are some highlights:
-
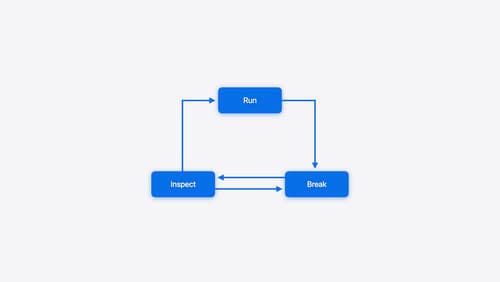
Debugging Techniques: The session "Run, Break, Inspect: Explore effective debugging in LLDB" covered various debugging techniques, including using crash logs, breakpoints, and the
pcommand for inspecting program state. It also introduced a new feature from Swift 6 that allows customization of how data types appear in the debugger. Run, Break, Inspect: Explore effective debugging in LLDB -
Crash Logs: LLDB can consume crash logs and present them in a form that resembles a debugging session, allowing developers to perform an initial investigation into how a crash happened. Run, Break, Inspect: Explore effective debugging in LLDB
-
Breakpoint Actions: The session also discussed how to use breakpoint actions to automate tasks when breakpoints are hit, which can help streamline the debugging process. Run, Break, Inspect: Explore effective debugging in LLDB
-
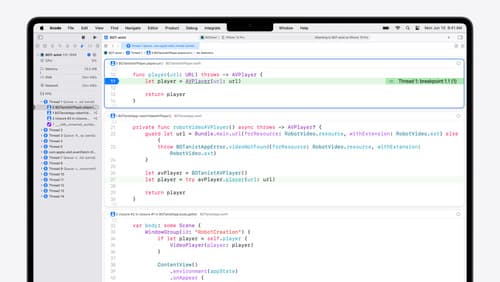
Swift Error Breakpoints: A new type of breakpoint was introduced that stops the application as soon as a Swift error is thrown, aiding in debugging Swift code. Run, Break, Inspect: Explore effective debugging in LLDB
-
Command Line Interface: LLDB's rich command line interface was highlighted, showing how it can be used to set breakpoints and perform other debugging tasks. Run, Break, Inspect: Explore effective debugging in LLDB
These updates aim to make debugging more efficient and provide developers with powerful tools to diagnose and fix issues in their code.
Run, Break, Inspect: Explore effective debugging in LLDB
Learn how to use LLDB to explore and debug codebases. We’ll show you how to make the most of crashlogs and backtraces, and how to supercharge breakpoints with actions and complex stop conditions. We’ll also explore how the “p” command and the latest features in Swift 6 can enhance your debugging experience.
What’s new in Xcode 16
Discover the latest productivity and performance improvements in Xcode 16. Learn about enhancements to code completion, diagnostics, and Xcode Previews. Find out more about updates in builds and explore improvements in debugging and Instruments.

What’s new in Swift
Join us for an update on Swift. We’ll talk about workflow improvements that make you more productive, and new and modernized library APIs for fundamental programming tasks. We’ll show examples of Swift adoption throughout more layers of the software stack. Finally, we’ll explore new language features for both improving approachability of concurrency, and achieving peak performance when you need it.